
Your First Data Engineering Project: Build an End-to-End Solution for Free with best tools
What If I Told You This SQL-Only Project Is What $200K Data Engineers Build Every Day?

The Challenge
You want to learn data engineering. But where do you start?
Courses teach theory. YouTube videos show demos. But you need hands-on experience. You need to build something real.
Here’s the problem. Cloud accounts need credit cards. Tools cost money. And most tutorial projects feel fake. They don’t match what companies actually do.
What if you could build a real data engineering project for free? Using the same tools that companies use? Without a credit card?
That’s what this guide will help you do.
What You Will Build
By the end of this guide, you will have:
A working data pipeline that runs every day
Real data from GitHub in your data warehouse
Transformed data ready for dashboards
A BI dashboard showing insights
A portfolio project you can show and tell in interviews
This is not a toy project. This is how many companies build their data solutions. The tools we use (Fivetran, Snowflake, dbt) are industry standards. You will learn patterns used in production systems.
Let’s get started.
Part 1: The Architecture
Before we build, let’s design. Good data engineers think about the big picture first.
The System Design Framework
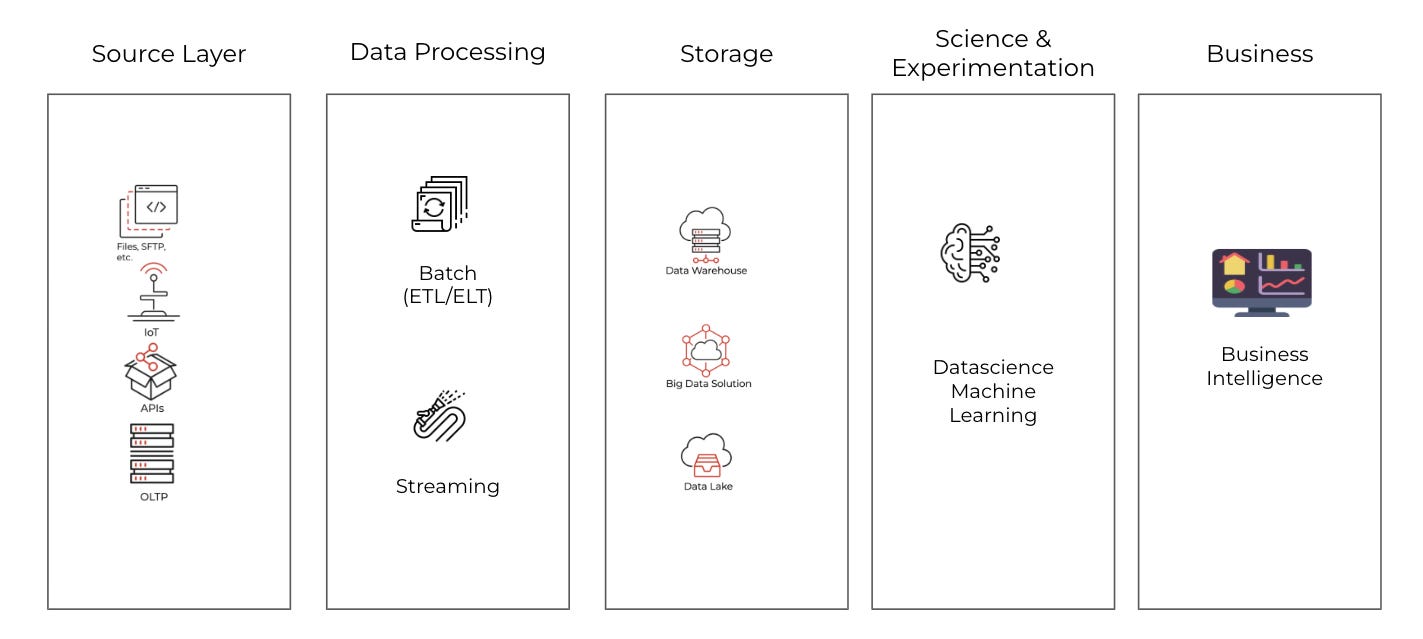
Every data solution has the same basic parts:
Source - Where data comes from
Ingestion - How data moves to storage
Storage - Where data lives
Transformation - How data gets cleaned and shaped
Consumption - How people use the data
I’ve covered this in detail in another blog post:

For our project, we will use the same approach as we would like to use (and know) for any data analytics project:
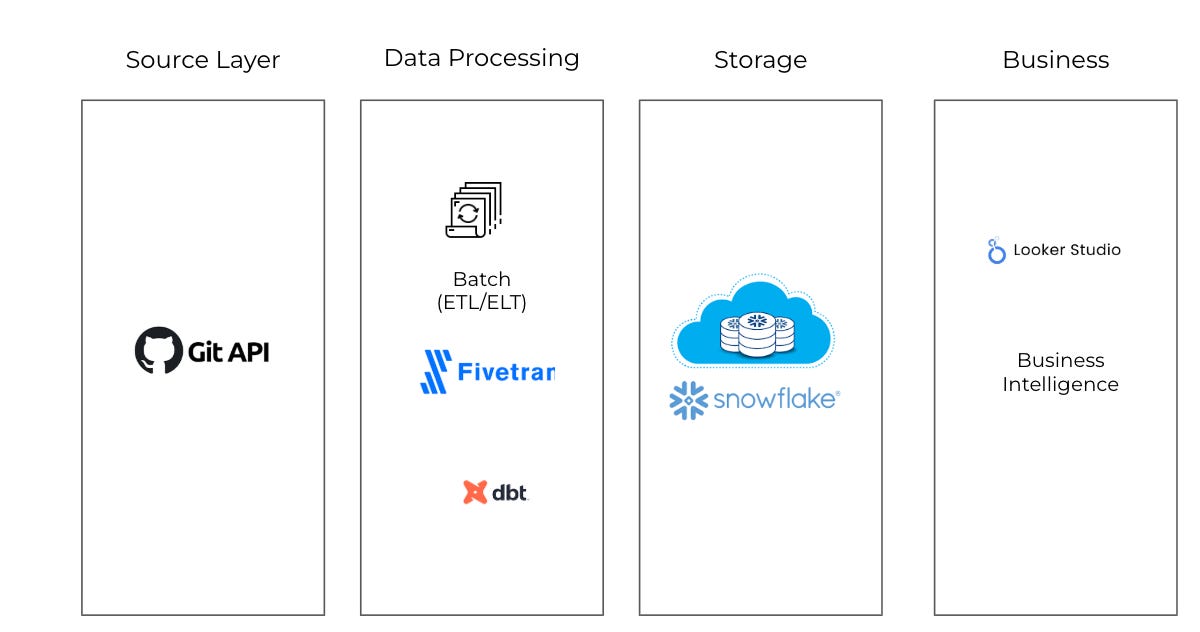
Why These Tools?
Source: GitHub API
Free to use
Rich data available
No business account needed
Ingestion: Fivetran
No code required
Reliable
14-day free trial
Storage: Snowflake
Most popular data warehouse
$400 in free credits
Transformation: dbt Cloud
Industry standard tool
Free developer plan
BI: Looker Studio
Free forever
Easy to learn
Part 2: The Data Source - GitHub API
What Data Will We Get?
GitHub stores data about code projects. The GitHub API lets us access this data. Fivetran has a connector that pulls this data for us.
We will get tables like:
Repositories - Project name, description, language, stars, forks
Commits - Code changes, authors, dates
Issues - Bug reports, feature requests
Pull Requests - Code review requests
Users - People who contribute
What Questions Can We Answer?
With this data, we can build dashboards that answer:
Which programming languages are most popular?
Which repos have the most stars?
How fast are repos growing?
Who are the most active contributors?
How many issues get closed vs stay open?
These are real business questions. Companies ask similar questions about their own data.
Alternative Data Sources
Don’t want GitHub data? You can use other free sources:
Relational database such as Postgres (Neon, RDS), SQL Server
Cloud Storage (S3, Azure Blob, Google Storage)
NoSQL database (MongoDB)
Numerous other APIs
What is an API?
An API (Application Programming Interface) is a messenger that lets different software applications talk to each other. Think of it as a waiter who takes your order to the kitchen and brings back your food.
Just think about it as a way to get the data from the external application.
How It Works
You make a request → Ask for data
API processes it → Finds what you need
You get a response → Receives the data
Basic Components
Endpoint: The URL where you access the API
https://api.example.com/users
Request Methods:
GET - Retrieve data
POST - Create new data
PUT - Update data
DELETE - Remove data
Response: Data returned (usually JSON format)
{
“name”: “John”,
“age”: 30
}
Part 3: Ingestion with Fivetran
What is Fivetran?
Fivetran is a data ingestion tool. It connects to data sources and copies data to your data warehouse. You don’t write code. You just click buttons.
Fivetran handles the hard parts:
Connecting to APIs
Handling errors and retries
Tracking what changed (incremental loading)
Keeping schemas in sync
How Often Should Data Sync?
This is an important decision. If you sync more often, it costs more money. If you sync less often, your data may be old.
Common sync options:
Every 15 minutes. Because Fivetran can.
Every hour: Best for business-critical dashboards.
Every 6 hours: Good for daily operations. Medium cost.
Every 24 hours: For historical analysis. Lowest cost.
For our project, we will sync once per day. This works well with the free trial. Daily syncs are usually enough for analytics dashboards.
The biggest disadvantage for Fivetran is its pricing model. Unlike traditional per-user or flat-rate subscriptions, Fivetran charges based on MAR (Monthly Active Rows), which can quickly become unpredictable and expensive as your data scales.

What is MAR?
Monthly Active Rows counts every row of data that Fivetran modifies, creates, or updates during a billing period. This includes:
New rows added to your tables
Existing rows that get updated
Rows that are re-synced or backfilled
Why MAR Pricing is Problematic
Unpredictable Costs: If your data changes frequently, your bill can spike unexpectedly. A single table with daily updates can generate millions of MARs.
Penalizes Data Growth: As your business grows and generates more data, your Fivetran costs grow exponentially—not linearly.
Hidden Complexity: Calculating MAR isn’t straightforward. Different connectors count rows differently, making it hard to forecast expenses.
Backfill Nightmares: Need to re-sync historical data? Every row counts toward your MAR, potentially doubling or tripling your monthly bill.
No Cost Control: Unlike compute-based pricing where you can pause resources, with MAR you’re charged for data movement whether you’re actively using it or not.
The Bottom Line
While Fivetran offers excellent reliability and ease of use, their MAR pricing model can lead to budget overruns and makes it difficult for growing companies to predict their data infrastructure costs. Many teams find themselves paying thousands more than anticipated once their data volume scales.
Alternatives to Fivetran

Fivetran is not the only tool you can use. Here are some other choices:
Fivetran: Managed and no-code. Good if you want to start quickly and don’t want to code.
Airbyte: Open source. Choose this if you want more control over the process.
Meltano: Open source and uses the command line. Best for developers who like working with CLI tools.
Custom Python: Write code to handle data syncing. Good for special situations or unique needs. Usually run by Airflow.
For learning, Fivetran is the easiest. Start here. Try alternatives later.
Part 4: Storage with Snowflake
What is Snowflake?
Snowflake is a cloud data warehouse. Think of it as a big database designed for analytics. It’s where all your data lives.

Snowflake is popular for good reasons:
Easy to use (SQL-based)
Scales automatically
Separates storage from compute (you pay for what you use)
Great documentation
Used by thousands of companies
Want to learn more? Check my last book - Jumpstart Snowflake: A Step-by-Step Guide to Modern Cloud Analytics
Setting Up Snowflake
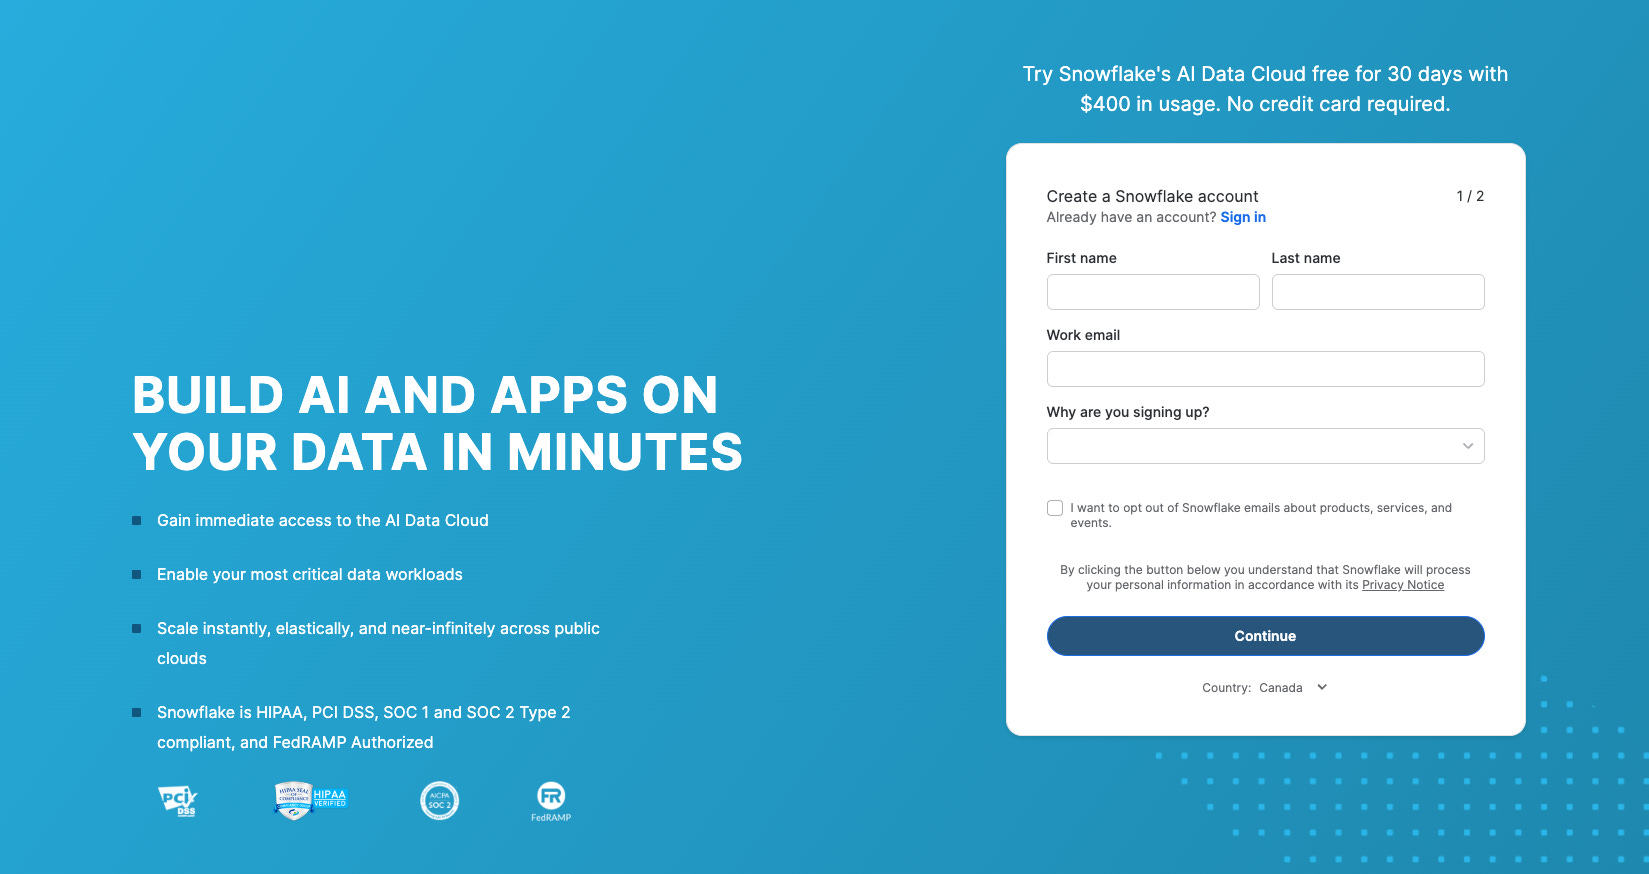
Step 1: Create an account at https://signup.snowflake.com/
Step 2: Create the database structure
Open a SQL worksheet in Snowflake. Run these commands:
-- Create databases for each layer
CREATE DATABASE GITHUB_RAW;
CREATE DATABASE GITHUB_STAGING;
CREATE DATABASE GITHUB_ANALYTICS;

-- Create schemas
CREATE SCHEMA GITHUB_RAW.FIVETRAN;
CREATE SCHEMA GITHUB_STAGING.STAGING;
CREATE SCHEMA GITHUB_ANALYTICS.MARTS;

-- Create a warehouse (compute) for running queries
CREATE WAREHOUSE TRANSFORM_WH
  WAREHOUSE_SIZE = 'X-SMALL'
  AUTO_SUSPEND = 60
  AUTO_RESUME = TRUE;
What did we just create?
GITHUB_RAW - Where Fivetran puts raw data
GITHUB_STAGING - Where we clean data
GITHUB_ANALYTICS - Where we put final tables for dashboards
TRANSFORM_WH - A small compute instance to run queries
Step 3: Create users for tools
Each tool needs its own login. This is good security practice.
-- Create a user for Fivetran
CREATE ROLE FIVETRAN_ROLE;
CREATE USER FIVETRAN_USER
  PASSWORD = 'ChooseAStrongPassword123!'
  DEFAULT_ROLE = FIVETRAN_ROLE;

GRANT ROLE FIVETRAN_ROLE TO USER FIVETRAN_USER;
GRANT USAGE ON WAREHOUSE TRANSFORM_WH TO ROLE FIVETRAN_ROLE;
GRANT ALL ON DATABASE GITHUB_RAW TO ROLE FIVETRAN_ROLE;

-- Create a user for dbt
CREATE ROLE DBT_ROLE;
CREATE USER DBT_USER
  PASSWORD = 'ChooseAnotherStrongPassword456!'
  DEFAULT_ROLE = DBT_ROLE;

GRANT ROLE DBT_ROLE TO USER DBT_USER;
GRANT USAGE ON WAREHOUSE TRANSFORM_WH TO ROLE DBT_ROLE;
GRANT USAGE ON DATABASE GITHUB_RAW TO ROLE DBT_ROLE;
GRANT SELECT ON ALL TABLES IN DATABASE GITHUB_RAW TO ROLE DBT_ROLE;
GRANT SELECT ON FUTURE TABLES IN DATABASE GITHUB_RAW TO ROLE DBT_ROLE;
GRANT ALL ON DATABASE GITHUB_STAGING TO ROLE DBT_ROLE;
GRANT ALL ON DATABASE GITHUB_ANALYTICS TO ROLE DBT_ROLE;
Save these passwords. You will need them later.
Data Layers Explained
We created three databases. This is called a “layered architecture.” Each layer has a job.
RAW Layer (Bronze)
Exact copy of source data
Fivetran manages this
We never change this data
If something breaks, we can always go back here
STAGING Layer (Silver)
Cleaned and typed data
Column names are consistent
Bad data is filtered out
dbt manages this
ANALYTICS Layer (Gold)
Business-ready tables
Aggregations and metrics
Ready for dashboards
dbt manages this
Some people call this “Medallion Architecture” (Bronze, Silver, Gold). Some call it “Raw, Stage, Marts.” The names don’t matter. The concept does.
Pro tip: You can skip the middle layer.
Alternatives to Snowflake
")
Snowflake, BigQuery, Redshift, and Synapse (now called Microsoft Fabric) are the most popular warehouse options. It means you can try another platform:
BigQuery: Good if you use Google Cloud Platform (GCP). GCP gives you $300 in credits.
Redshift: Ideal for people using Amazon Web Services (AWS). There is an AWS free tier.
Synapse: Best for Azure users. Azure gives free credits.
For learning the modern data stack, Snowflake is the best choice. Most job postings mention it.
Part 5: Finish Fivetran Setup
Now that Snowflake is ready, let’s finish Fivetran.
Step 1: Add Snowflake as a destination
In Fivetran, go to Destinations
Click “Add Destination”
Choose “Snowflake”
Enter your Snowflake details:
Account: Your Snowflake account URL
User: FIVETRAN_USER
Password: The password you created
Database: GITHUB_RAW
Schema: FIVETRAN
Warehouse: TRANSFORM_WH
Test the connection
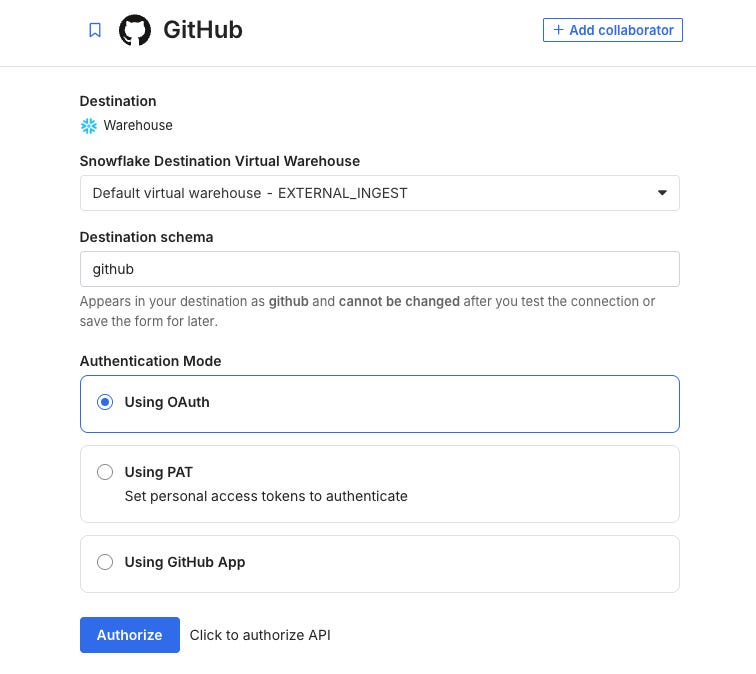
Step 2: Add GitHub connector
Go to Connectors
Click “Add Connector”
Search for “GitHub”
Click “Set Up”
Authenticate with your GitHub account
Select which repos or organizations to sync
Choose sync frequency: Daily
Start the sync
Fivetran will now pull data from GitHub and put it in Snowflake. The first sync takes a few minutes. After that, it runs daily.
Part 6: Data Modelling Concepts
Before we build dbt models, let’s learn two important concepts. These come up in every data engineering interview.

Dimensional Modelling
Dimensional modelling is how we organize data for analytics. It’s the most common approach for data warehouses.
The idea is simple. We have two types of tables:
Fact Tables - Store events and measurements
Things that happen: orders, clicks, commits
Have numbers you can add up: revenue, count, duration
Named with the prefix
fct_
Dimension Tables - Store descriptions
Things that describe facts: customers, products, dates
Have text and categories: name, type, status
Named with prefix
dim_
For our GitHub project:
fct_repo_activity (Fact table): Stores daily counts of commits, pull requests, and issues for each repository.
dim_repositories (Dimension table): Stores details about each repository, like name, language, owner, and description.
dim_users (Dimension table): Stores user information, such as username, name, and profile details.
dim_dates (Dimension table): Stores date-related details, such as the date, month, quarter, and year.
Star Schema
When you draw this, the fact table sits in the middle. Dimension tables connect to it like points of a star.
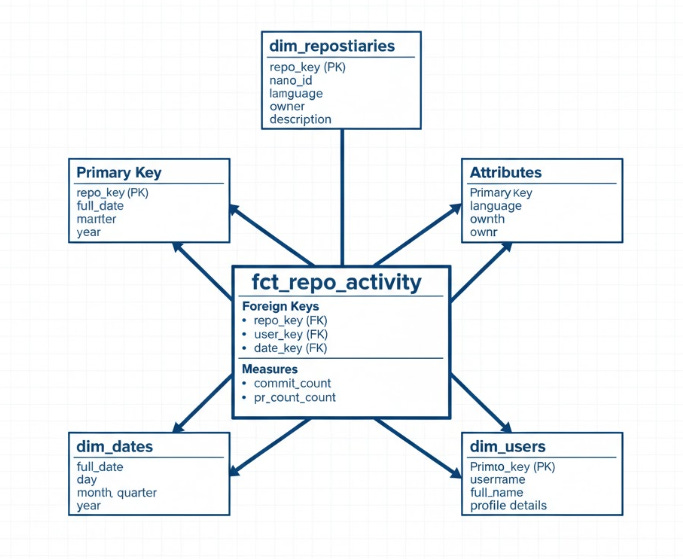
This design makes queries fast. BI tools love it.
Slowly Changing Dimensions (SCD)
Here’s a problem. What happens when data changes over time?
A GitHub user changes their username. A repo changes owner. How do we handle this?
This is called “Slowly Changing Dimensions” or SCD. There are different approaches:
SCD Type 1 - Overwrite
Just replace the old value with the new one.
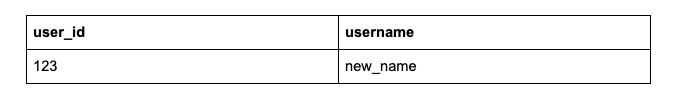
Simple. But we lose history. We can’t see what the old username was.
SCD Type 2 - Keep History
Add new rows for changes. Track when each version was valid.
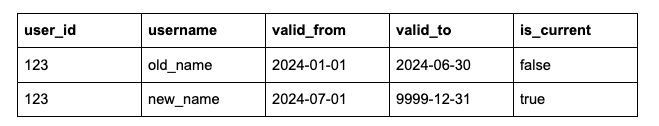
More complex. But we keep the full history. We can see what the username was at any point in time.
Which to choose?
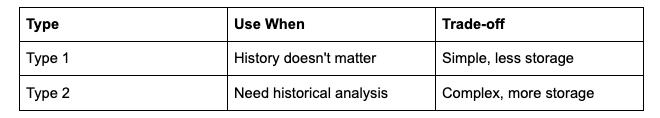
For our project, we’ll start with Type 1. It’s simpler. You can add Type 2 later using dbt snapshots.
Interview Tip: Interviewers love asking about SCD. Be ready to explain Type 1 vs Type 2 and when to use each.
Part 7: Transformation with dbt
What is dbt?
dbt stands for “data build tool.” It transforms data using SQL.

Here’s how it works:
You write SQL SELECT statements
dbt runs them and creates tables
dbt tracks dependencies between tables
dbt tests your data for quality
dbt is the industry standard for data transformation. Almost every modern data team uses it.
Pro tip: SQL = dbt model
dbt is the most important part of this project. It ties together data warehouse, data ingestion, business logic, software engineering practices and so on. You definitely need to invest time in this tool and understand it well.
Check their learning page: https://learn.getdbt.com/catalog
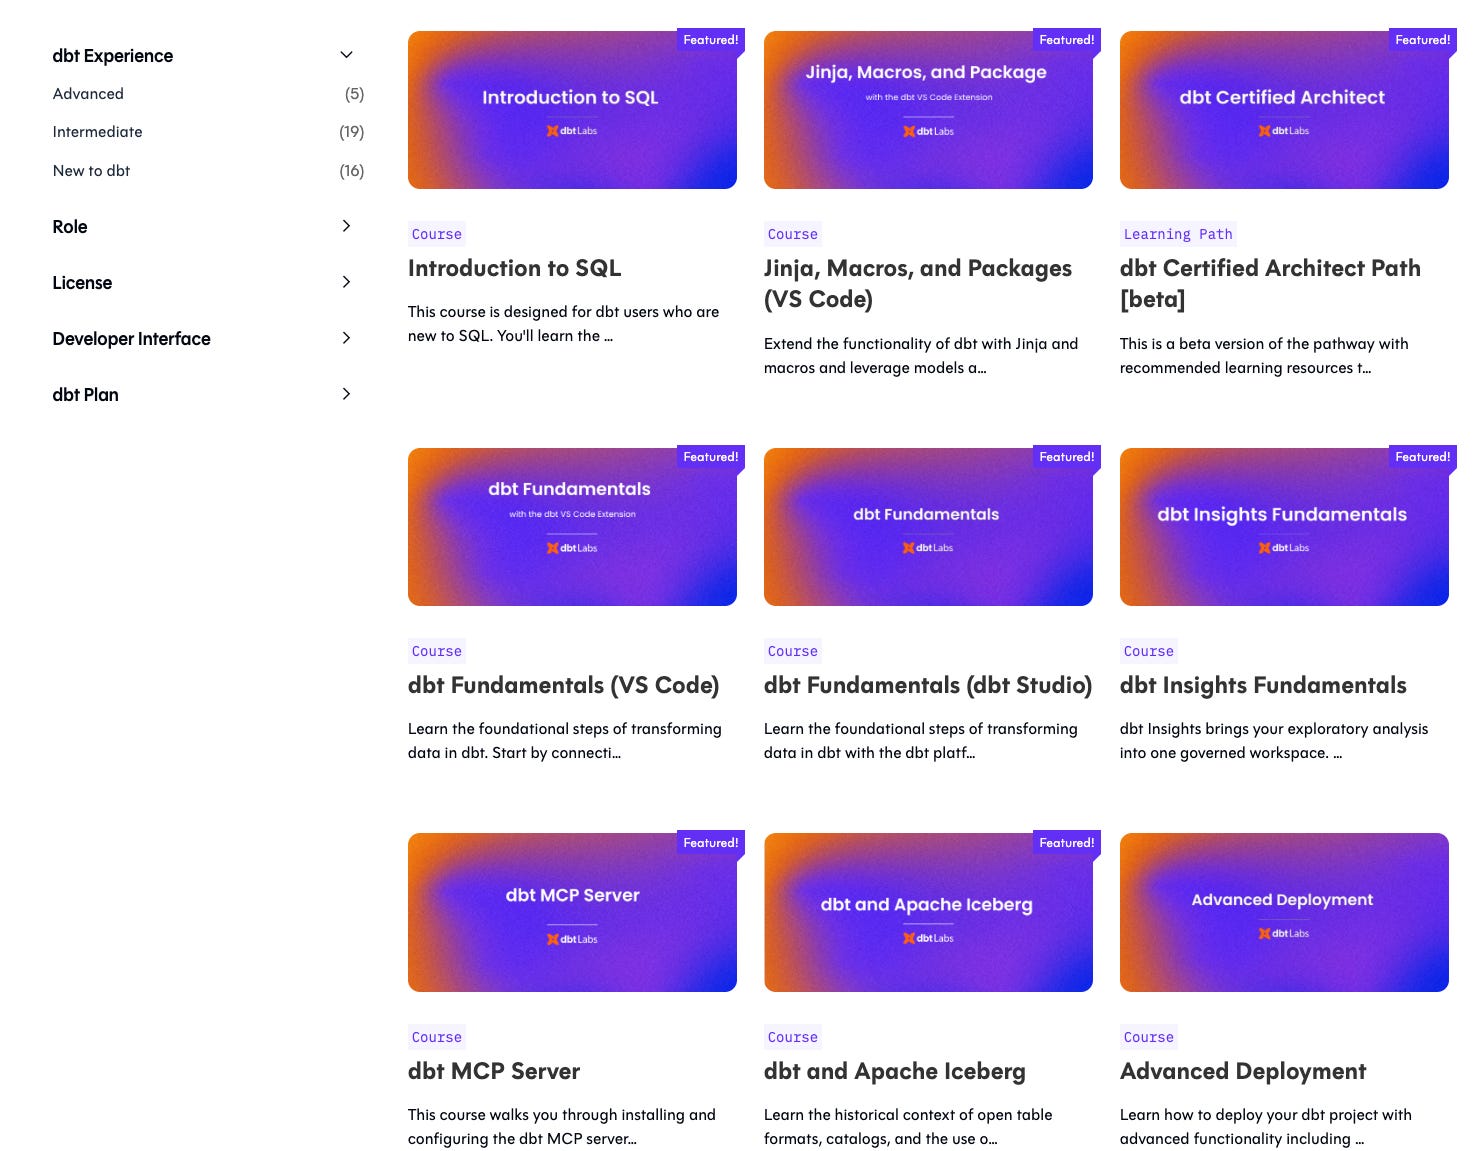
You probably need only the fundamentals course.
Setting Up dbt Cloud
Step 1: Create an account at https://www.getdbt.com/signup
Step 2: Create a GitHub repository
Go to github.com
Create a new repository called “github-analytics-dbt”
Make it public (easier for portfolio)
Initialize with a README
We covered this in module 0:"
Step 3: Connect dbt to GitHub
In dbt Cloud, create a new project
Connect to your GitHub repository
dbt will sync code automatically
Step 4: Connect dbt to Snowflake
Add a Snowflake connection
Enter details:
Account: Your Snowflake account
User: DBT_USER
Password: The password you created
Database: GITHUB_STAGING (default)
Warehouse: TRANSFORM_WH
Test the connection
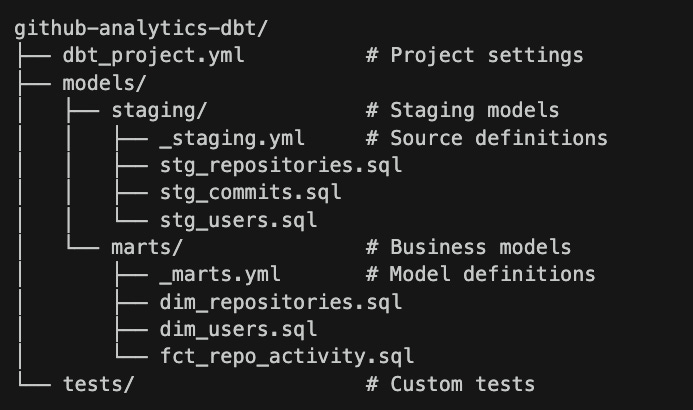
dbt Project Structure
dbt projects have a standard structure:
Creating dbt Models
Let’s build the models. You have the options here. You can use the dbt labs studio and build all models in web browser. Or you can use IDEs uch as VSCode. We covered this as well:
Or you may want to leverage AI in full swing:
If you will use an IDE, you will need to define a connection to Snowflake and dbt Labs. I highly recommend using this. Moreover, you can use the IDE dbt core (open source) instead of dbt Labs.
Now, let’s add the models.
First, define sources
Create models/staging/_staging.yml:
version: 2

sources:
  - name: github_raw
    database: GITHUB_RAW
    schema: FIVETRAN
    tables:
      - name: repository
      - name: commit
      - name: user
      - name: issue
      - name: pull_request
This tells dbt where the raw data lives.
Create staging models
Staging models, clean and rename data. They don’t change the grain (one row per source row).
Create models/staging/stg_repositories.sql:
WITH source AS (
    SELECT * FROM {{ source('github_raw', 'repository') }}
),

cleaned AS (
    SELECT
        -- Primary key
        id AS repository_id,

        -- Attributes
        name AS repository_name,
        full_name,
        owner_login AS owner_username,
        description,
        language,

        -- Metrics
        stargazers_count AS stars,
        forks_count AS forks,
        open_issues_count AS open_issues,

        -- Dates
        created_at,
        updated_at,
        pushed_at
    FROM source
    WHERE id IS NOT NULL
)

SELECT * FROM cleaned
Create models/staging/stg_users.sql:
WITH source AS (
    SELECT * FROM {{ source('github_raw', 'user') }}
),

cleaned AS (
    SELECT
        id AS user_id,
        login AS username,
        name AS display_name,
        email,
        company,
        location,
        bio,
        public_repos AS public_repo_count,
        followers AS follower_count,
        following AS following_count,
        created_at,
        updated_at
    FROM source
    WHERE id IS NOT NULL
)

SELECT * FROM cleaned
Create mart models
Mart models are business-ready. They aggregate and join data. It means we would have only two layers in our data warehouse - Mart (Gold) and Staging (Bronze)
Create models/marts/dim_repositories.sql:
WITH repositories AS (
    SELECT * FROM {{ ref('stg_repositories') }}
)

SELECT
    repository_id,
    repository_name,
    full_name,
    owner_username,
    description,
    language,
    stars,
    forks,
    open_issues,
    created_at AS repo_created_at,
    updated_at AS repo_updated_at,
    pushed_at AS last_push_at
FROM repositories
Create models/marts/dim_users.sql:
WITH users AS (
    SELECT * FROM {{ ref('stg_users') }}
)

SELECT
    user_id,
    username,
    display_name,
    email,
    company,
    location,
    bio,
    public_repo_count,
    follower_count,
    following_count,
    created_at AS user_created_at
FROM users
Create models/marts/fct_daily_stats.sql:
WITH repositories AS (
    SELECT * FROM {{ ref('stg_repositories') }}
),

daily_stats AS (
    SELECT
        DATE_TRUNC('day', updated_at) AS stat_date,
        language,
        COUNT(*) AS repo_count,
        SUM(stars) AS total_stars,
        SUM(forks) AS total_forks,
        ROUND(AVG(stars), 2) AS avg_stars,
        ROUND(AVG(forks), 2) AS avg_forks
    FROM repositories
    WHERE language IS NOT NULL
    GROUP BY 1, 2
)

SELECT * FROM daily_stats
Configure models
version: 2

sources:
  - name: github_raw
    database: GITHUB_RAW
    schema: FIVETRAN
    tables:
      - name: repository
      - name: commit
      - name: user
      - name: issue
      - name: pull_request

models:
  - name: stg_repositories
    description: "Cleaned repository data from GitHub"
    columns:
      - name: repository_id
        description: "Unique identifier for the repository"
        tests:
          - unique
          - not_null
      - name: repository_name
        description: "Name of the repository"
        tests:
          - not_null
      - name: language
        description: "Primary programming language"

  - name: stg_users
    description: "Cleaned user data from GitHub"
    columns:
      - name: user_id
        description: "Unique identifier for the user"
        tests:
          - unique
          - not_null
Create models/marts/_marts.yml:
version: 2

models:
  - name: dim_repositories
    description: "Dimension table for repositories"
    columns:
      - name: repository_id
        description: "Primary key"
        tests:
          - unique
          - not_null

  - name: dim_users
    description: "Dimension table for users"
    columns:
      - name: user_id
        description: "Primary key"
        tests:
          - unique
          - not_null

  - name: fct_daily_stats
    description: "Daily statistics by language"
    columns:
      - name: stat_date
        description: "Date of the statistics"
        tests:
          - not_null
Update dbt_project.yml
name: 'github_analytics'
version: '1.0.0'

profile: 'default'

model-paths: ["models"]
test-paths: ["tests"]

target-path: "target"
clean-targets:
  - "target"
  - "dbt_packages"

models:
  github_analytics:
    staging:
      +schema: staging
      +materialized: view
    marts:
      +schema: marts
      +materialized: table
Running dbt
In dbt Cloud:
Open the IDE
Click “Run” or type
dbt runWatch the models build
Click “Test” or type
dbt testCheck for failures
You can also create a job to run daily:
Go to Jobs
Create a new job
Add command:
dbt run && dbt testSchedule: After Fivetran completes (e.g., 2 AM daily)
Enable notifications
Part 8: Dashboards with Looker Studio
Why Looker Studio?
Looker Studio (formerly Google Data Studio) is free. Forever. No trial period.
It connects directly to Snowflake. It’s easy to learn. And it looks professional.

Setting Up Looker Studio
Step 1: Open Looker Studio
Go to lookerstudio.google.com
Sign in with your Google account
Step 2: Connect to Snowflake
Click “Create” → “Data Source”
Search for “Snowflake”
Click “Authorize” to install the connector
Enter your Snowflake details:
Account identifier: Your Snowflake account
Username: DBT_USER
Password: Your password
Warehouse: TRANSFORM_WH
Database: GITHUB_ANALYTICS
Schema: MARTS
Choose a table (start with fct_daily_stats)
Click “Connect”
Step 3: Create a dashboard
Click “Create Report”
Add your data source
Start adding charts
Dashboard Ideas
Dashboard 1: Language Popularity
Charts to include:
Pie chart: Total repos by language
Bar chart: Total stars by language
Line chart: Stars over time
Scorecard: Total repositories
Dashboard 2: Top Repositories
Charts to include:
Table: Top 20 repos by stars
Bar chart: Repos with most forks
Scatter plot: Stars vs forks relationship
Dashboard 3: Activity Trends
Charts to include:
Line chart: New repos per week
Bar chart: Most active languages
Table: Recent updates
Tips for Good Dashboards
Keep it simple. Don’t add too many charts.
Use consistent colors.
Add titles that explain what the chart shows.
Put the most important insights at the top.
Add date filters so users can explore.
Part 9: What You Built
Let’s recap. You now have:
This is a real data engineering solution. Companies use the same architecture. The same tools. The same patterns.
And we didn’t touch a single line of Python! Imagine a Senior Data Engineer will earn 200k US or 180k CAD for the same setup.
The key is not the tools, but the system design basics.
Part 10: What’s Next?
You have a working project. But there’s always more to learn. Here are the next steps to make your project better.
Add Data Quality Tests
dbt has built-in tests. Add more:
# In your yml files

columns:

  - name: stars

    tests:

      - not_null

      - dbt_utils.accepted_range:

          min_value: 0
Add Documentation
dbt generates documentation automatically:
dbt docs generate

dbt docs serve
This creates a website showing all your models and their relationships.
Implement SCD Type 2
Use dbt snapshots to track history:
{% snapshot repositories_snapshot %}

{{

    config(

      target_schema=’snapshots’,

      unique_key=’repository_id’,

      strategy=’timestamp’,

      updated_at=’updated_at’,

    )

}}

SELECT * FROM {{ source(’github_raw’, ‘repository’) }}

{% endsnapshot %}
Add CI/CD
Set up GitHub Actions to test your dbt code on every pull request.
Add Infrustructure as a Code
Try to use Terraform for your Snowflake or cloud data infrastructure.
Add the Orchestration tool
Add Airflow or a similar tool, such as Dagster, Prefect or you can go all in on Python and run AWS Lambdas to ingest data.
Monitor Costs
Snowflake charges for compute time. Monitor your credits:
Go to Admin → Cost Management
Set up alerts before credits run out
Use smaller warehouses when possible
Add More Data Sources
Once you’re comfortable, add more sources:
A PostgreSQL database
A Google Sheets file
A Jira or Notion integration
Each new source teaches you something new.
Key Takeaways
You can learn data engineering for free. Enterprise tools offer generous trials.
You don’t need a cloud account. Snowflake, dbt Cloud, and Fivetran work on their own.
This is production-ready architecture. Companies use the same patterns.
Dimensional modelling matters. Learn facts, dimensions, and star schemas.
Know your SCDs. Type 1 vs Type 2 is an interview favourite.
Start simple. Get it working first. Optimize later.
This project shows real skills. Put it on your resume. Talk about it in interviews.
Final Words
You now know how to build a real data engineering project. For free. Using enterprise tools.
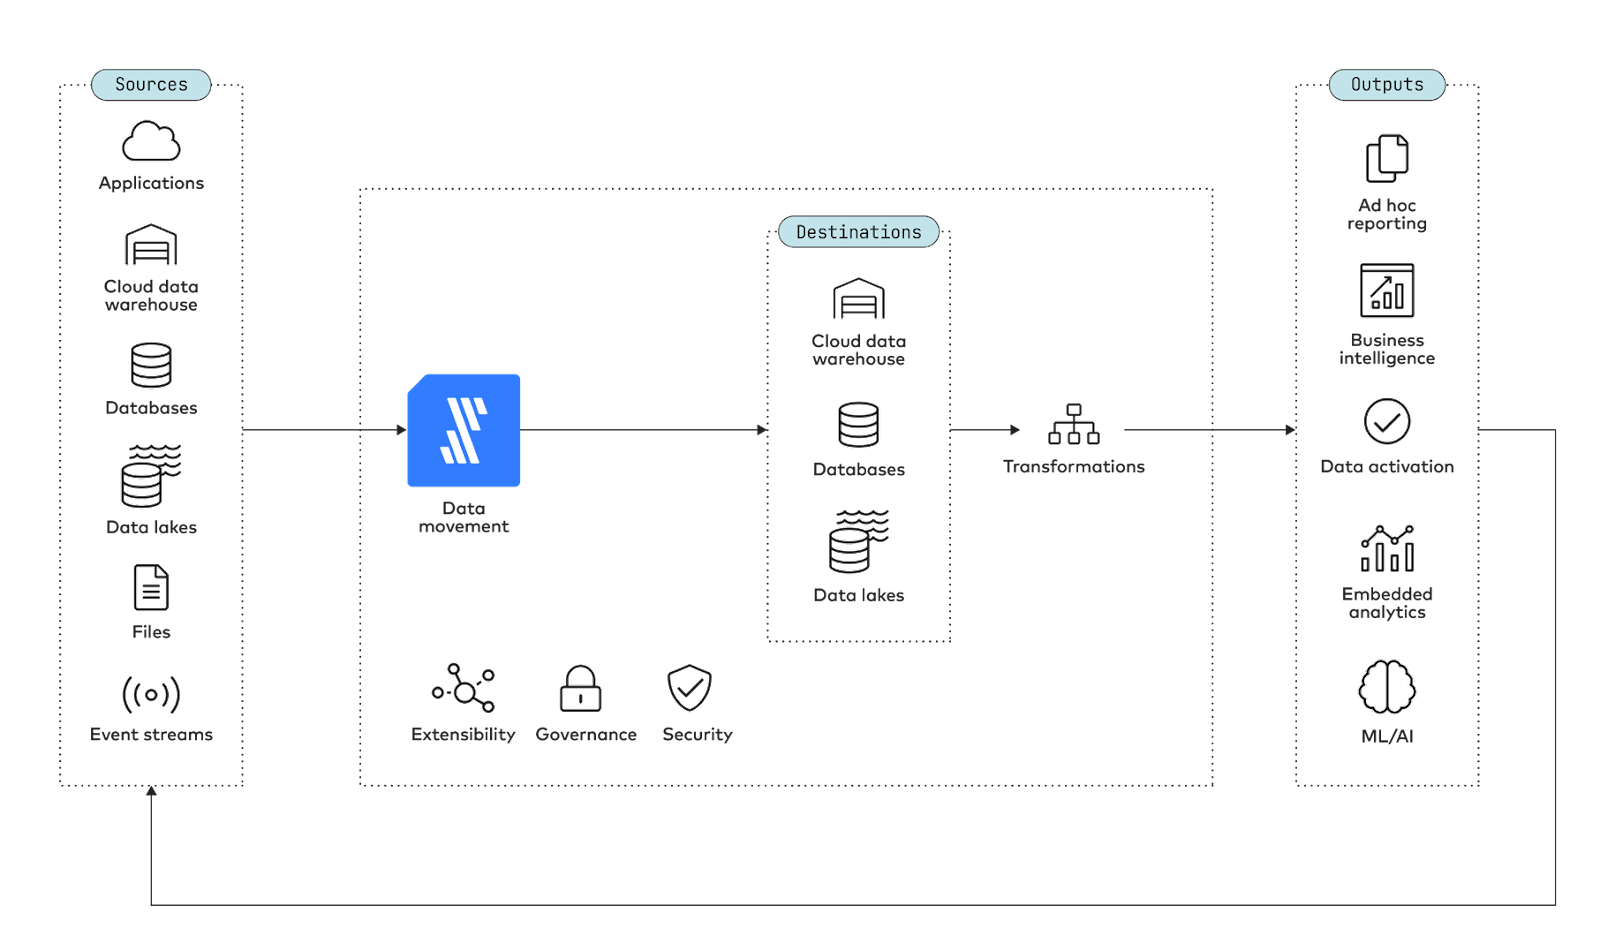
This is how modern data teams work. Source data flows through ingestion, lands in storage, gets transformed, and powers dashboards. The same pattern. Every time.
Build this project. Put it on GitHub. Add it to your resume. Talk about it in interviews.
You’ve got this.