
🎯Ultimate cheatsheet for Data Engineering System Design interview.
Because 'It Depends' Is a Valid Answer (But You Still Need to Know What It Depends On)

The 45-Minute Challenge
Imagine you’re sitting in a System Design interview. The interviewer just gave you a couple of sentences about requirements, and now you have around 45 minutes to dive deep into the architecture of a data engineering system. Your whiteboard is blank. The clock is ticking. ⏰
Sound familiar?
Whether you’re prepping for an interview or just want to level up your architectural thinking, this guide will give you a framework to tackle any data engineering system design challenge with confidence.
Let’s break it down.
🗺️ The Master Architecture
Before we dive into the details, here’s the high-level view of what we’re building. A solid data engineering system has six essential layers:
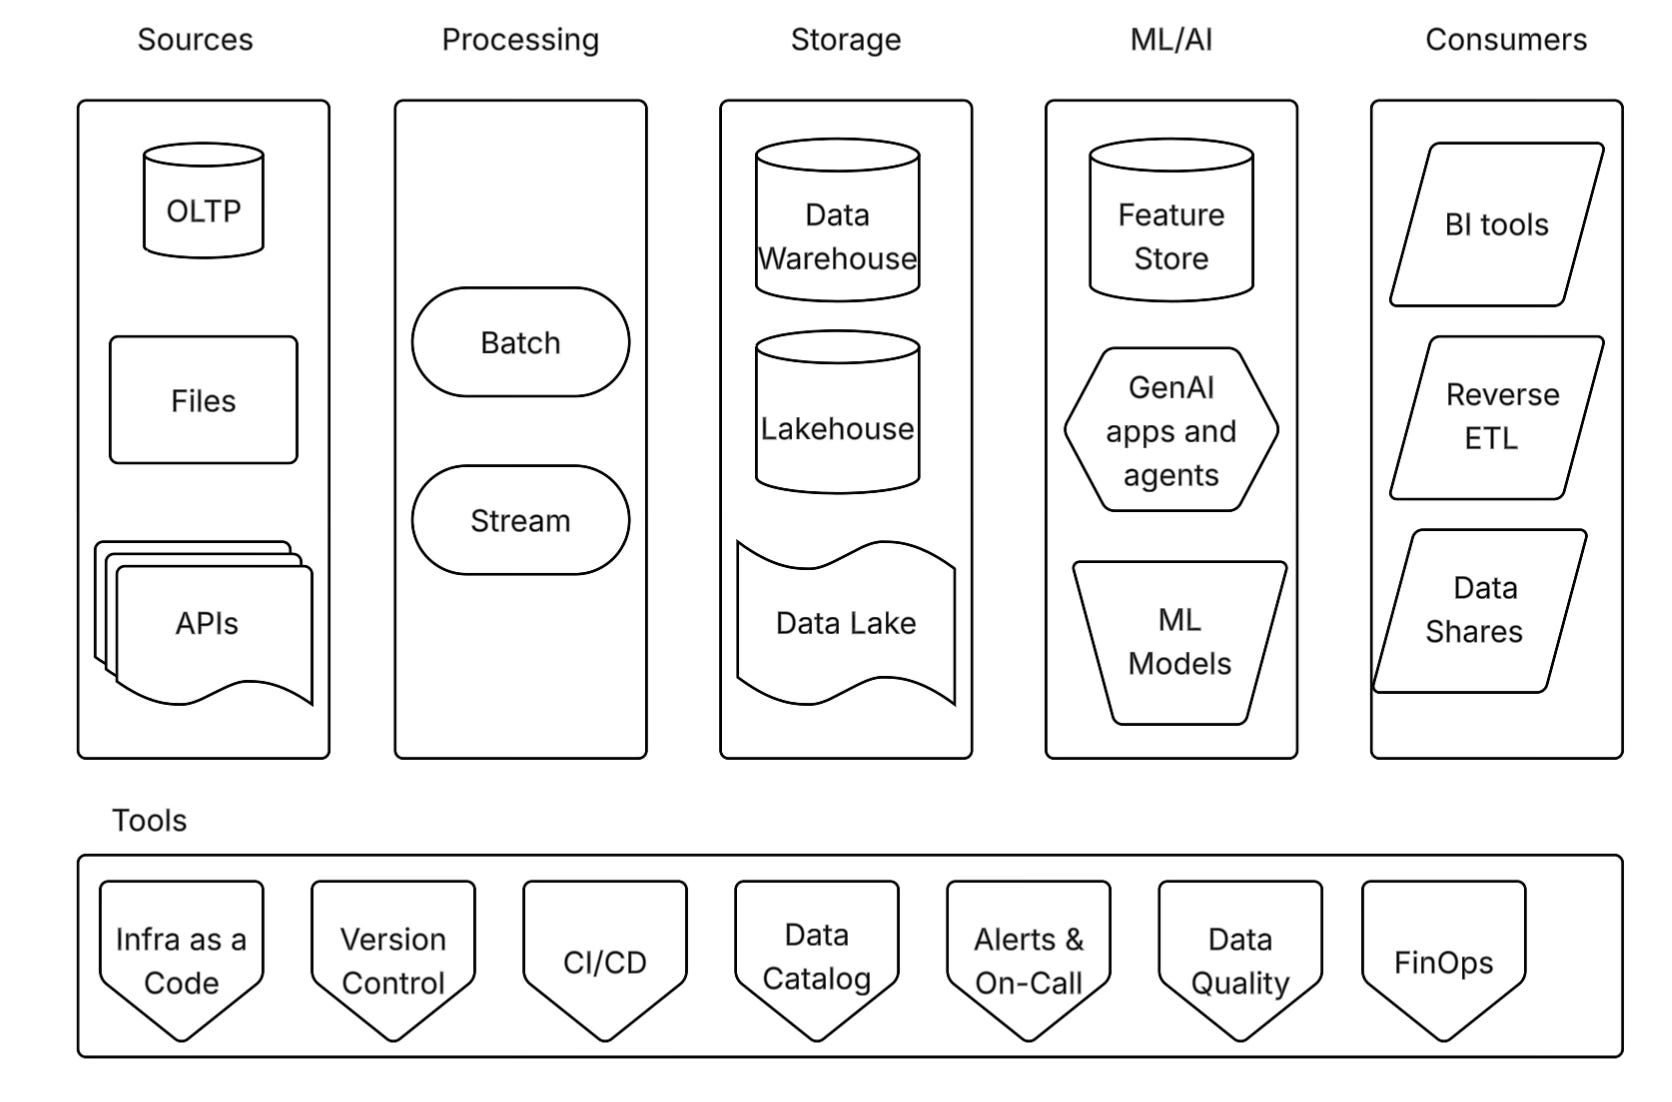
Think of this as your mental model. Every system design conversation should touch on these layers, though you’ll spend more time on some than others depending on the requirements.
📊 Sources Layer
    ↓
⚙️ Processing Layer
    ↓
💾 Storage Layer
    ↓
🤖 ML/AI Layer (Optional)
    ↓
👥 Consumers Layer
    ↓
🛠️ Tools Layer (Cross-cutting)
🎬 Where Do You Start?
First of all, you can decide where to start. From top to bottom or bottom to top?
Here’s the truth: It doesn’t really matter for data engineering architecture. You can start with sources and work your way down, or start with consumers and work backwards. Both approaches work.
However, there’s one exception: data modelling interviews. If you’re specifically being asked about data modelling, start from the consumer requirements and work backwards. This shows you’re thinking about the business use case first.
💡 Pro Tip: Tell a Story, Don’t Just Draw Boxes
Use a drawing board like Drawio, Lucidchart, or at least Google Slides. Tell the story of how data flows through your system. Don’t just list components—explain why each piece exists and how they connect.
The best candidates I’ve interviewed don’t just draw architecture; they narrate the data journey. “First, we capture events from the application, then we...” That storytelling makes all the difference.
📚 The Six Essential Layers (Deep Dive)
1️⃣ Source Layer: Where It All Begins
This is where you show you understand how businesses actually generate data. Start by listing the available sources based on what the interviewer told you.
Common source types:
🗄️ OLTP Databases - PostgreSQL, MySQL, SQL Server (transactional systems)
📁 Files - CSV, JSON, Parquet on SFTP, S3, Azure Blob
🌐 APIs - REST APIs, webhooks, third-party SaaS tools
📨 Event Streams - Kafka, RabbitMQ, AWS Kinesis, Azure Event Hubs
📱 IoT Devices - Sensor data, mobile apps, edge devices
Questions you MUST ask:
What’s the data volume? Are we talking about gigabytes or petabytes? This drives your storage and processing decisions.
What are the latency requirements? Do users need data in seconds, minutes, or hours? This determines batch vs stream processing.
What data formats are we dealing with? Structured (tables), semi-structured (JSON), or unstructured (images, documents)?
How is the business generating this data? Understanding the business context is crucial. Is this customer data? Transaction logs? Clickstream events?
Do we have CDC (Change Data Capture)? If the source is a database, can we capture incremental changes, or do we need full table dumps?
*Why this matters: The source layer defines your constraints. If you have real-time event streams, you can’t just batch process them once a day. If you’re pulling from a legacy SFTP server with nightly file drops, streaming might be overkill.
Talk through the sources. Ask questions. Show curiosity. This demonstrates you’re not just memorizing patterns—you’re thinking about real systems.
2️⃣ Storage Layer: Where You Show Your Knowledge 🎓
This is your moment to shine. Storage decisions are your primary responsibility as a data engineer. This is where you separate the junior engineers from the senior ones.
The big question: Where do we store the data?
The Three Main Options:
🏢 Data Warehouse
Examples: Snowflake, BigQuery, Redshift, Synapse
Best for: Structured data, SQL analytics, BI reporting
Pros: Optimized for queries, easy to use, great for business users
Cons: Can be expensive, less flexible for ML workloads, vendor lock-in
🏞️ Data Lake
Examples: Storage in S3, Azure Data Lake Storage, Google Cloud Storage with separated compute like Spark, Trino, Athena, EMR, Dataproc, Synapse and etc.
Best for: Large-scale raw data, unstructured data, cost-effective storage
Pros: Cheap storage, flexible, supports any format
Cons: Can become a “data swamp,” requires more engineering effort
🏰 Lakehouse
Examples: Databricks (Delta Lake), Snowflake (Iceberg), Dremio, Trino
Best for: Combined analytics + ML workloads, flexible architecture
Pros: Best of both worlds, ACID transactions on data lake, unified platform
Cons: Newer paradigm, some tools still maturing
How to Choose?
Ask these questions:
What public cloud are you using? Azure, AWS, or GCP? Each has native options that integrate well.
Do you already have a data warehouse? Don’t reinvent the wheel if something is working.
What are the query patterns?
Mostly SQL reporting → Warehouse
Mostly ML/data science → Lake/Lakehouse
Both → Lakehouse
What’s the data volume and growth rate? Petabyte-scale often favors lake/lakehouse for cost reasons.
⚠️ Important:There is no wrong answer. Each approach has trade-offs. What matters is that you can justify your choice based on the requirements.
Architecture Patterns to Mention
Medallion Architecture (Bronze → Silver → Gold) - This is especially popular in lakehouse architectures:
Bronze (Raw): Land data exactly as received. Immutable, append-only.
Silver (Cleaned): Deduplicated, validated, standardized formats.
Gold (Business-level): Aggregated metrics, dimensional models, ready for consumption.
Why it’s great: Clear separation of concerns, easy to troubleshoot, supports both batch and streaming.
Dimensional Modeling (Star/Snowflake Schema) - Still relevant for traditional data warehouse approaches:
Fact tables (events, transactions)
Dimension tables (customers, products, dates)
Optimized for BI tools and reporting
Don’t dismiss this as “old school.” Many business users still need simple, well-defined dimensional models.
Data Transformation Strategy
The question: How will you transform the data?
The default answer: dbt (SQL-based transformation) 🎯
Why dbt is often the right choice:
✅ SQL is accessible to more team members
✅ Built-in testing and documentation
✅ Version control and CI/CD friendly
✅ Strong community and ecosystem
✅ Works with all major warehouses and lakehouses
Alternatives to mention:
Spark (PySpark/Scala) - For large-scale transformations, complex logic
Python/Pandas - For ML feature engineering, custom logic
Stored Procedures - Legacy systems (mention you’d migrate away from these)
Pro tip: Start with SQL/dbt. Only reach for Spark when you truly need it. Complexity should be justified.
3️⃣ Consumers Layer: Start With the End in Mind 👥
This is how the data insights will be used. Understanding your consumers drives everything else.
Who are the target audiences?
📊 Business Analysts
Tools: Tableau, Power BI, Looker, Mode
Needs: Pre-aggregated tables, dimensional models, fast queries
Frequency: Daily dashboards, ad-hoc queries
🔬 Data Scientists
Tools: Jupyter notebooks, Python, R
Needs: Raw and feature-engineered datasets, ML-ready formats
Frequency: Varies by project phase
🤖 Applications
Tools: REST APIs, GraphQL, Reverse ETL tools
Needs: Low-latency access, real-time or near-real-time data
Frequency: Continuous, high QPS (queries per second)
🤝 External Partners
Tools: Data shares (Snowflake), secure APIs, file exports
Needs: Governed, secure access to specific datasets
Frequency: Scheduled or on-demand
🧠 GenAI Applications
Tools: Vector databases, RAG pipelines, LLM APIs
Needs: Embeddings, semantic search, context retrieval
Frequency: Real-time or batch depending on use case
Critical questions to ask:
How frequently do they need data? Every 15 minutes? Once an hour? Once a day? This determines your SLA and processing cadence.
What’s the acceptable data latency? There’s a big difference between “yesterday’s data” and “last 5 minutes of data.”
What format do they prefer? SQL-accessible tables? JSON via API? CSV files? Parquet on S3?
What’s the scale? How many users? How many queries per minute?
Why this matters: Consumer requirements drive your architecture decisions. If your BI team needs data once a day, you can batch process overnight. If your fraud detection app needs real-time data, you’re building a streaming pipeline.
The best engineers I’ve worked with always start by understanding the consumer needs. That’s how you avoid over-engineering (or under-engineering).
4️⃣ Processing Layer: Batch vs Stream ⚙️
This is how we move data from the Source Layer to the Storage Layer.
There are fundamentally only two options: Batch and Stream.
🔄 Batch Processing (The Default Choice)
Why batch is great:
✅ Simple to understand and maintain
✅ Easy to debug and replay
✅ Cost-effective (run when you need to)
✅ Well-established patterns and tools
✅ Handles large historical data well
Common tools:
Airflow (orchestration)
dbt (transformation)
Spark (heavy lifting)
Fivetran/Airbyte (managed ingestion)
Typical patterns:
Full refresh: Replace entire table (simple but inefficient)
Incremental loading: Only process new/changed records
Time-based partitioning: Process data by date ranges
When to use batch:
Daily reporting and analytics
Historical data analysis
When near-real-time isn’t required
When simplicity is more important than latency
🌊 Stream Processing (When You Need It)
When streaming is required:
Real-time dashboards and alerting
Fraud detection (sub-second response)
IoT sensor data (constant flow)
Application events (clickstream, user activity)
Financial transactions (immediate reconciliation)
Common tools:
Kafka / Confluent (event streaming)
Spark Streaming / Structured Streaming
Flink (low-latency complex event processing)
AWS Kinesis / Azure Event Hubs (managed services)
The hybrid approach:
This is actually very common in real systems:
Stream events into cloud storage (S3, ADLS)
Process from storage in micro-batches
Get near-real-time results without full streaming complexity
Why this works: You get durability and replay capability from storage, without the operational complexity of true streaming.
🎯 Critical Concepts to Mention (Show You Know Production)
1. Idempotency
Your pipeline should produce the same result if you run it multiple times. Running the same job twice shouldn’t create duplicate records.
Example: Use MERGE/UPSERT instead of INSERT. Key on unique business keys.
2. CDC (Change Data Capture)
Capture only what changed in the source system instead of pulling full tables every time.
Tools: Debezium, AWS DMS, Fivetran, Airbyte
3. Incremental Loading
Only process new or changed data. Track watermarks, timestamps, or sequence IDs.
-- Example: Load only records modified since last run
WHERE updated_at > (SELECT MAX(updated_at) FROM target_table)
4. Data Quality Checks
Validate data at ingestion and transformation stages:
Schema validation (expected columns present?)
Null checks (required fields populated?)
Range checks (values within expected bounds?)
Referential integrity (foreign keys valid?)
Freshness checks (data arriving on time?)
Tools: Great Expectations, dbt tests, custom validation
5. Schema Evolution
How do you handle when source systems add/remove/rename columns?
Strategies:
Schema-on-read (flexible but risky)
Schema validation (strict but safe)
Graceful degradation (log issues, don’t fail)
💡 Pro tip: Batch is a great default choice. Lead with that. Then say, “But for use cases like [specific example from requirements], we’d need streaming.”
Don’t over-engineer. Streaming adds complexity. Only use it when latency truly matters to the business.
5️⃣ ML/AI Layer: The Optional But Impressive Section 🤖
Here’s the secret: No one expects you to cover this, but if you do, you’ll stand out.
This shows you understand modern data platforms aren’t just for reporting—they’re powering machine learning and AI applications.
Components to Mention
🗃️ Feature Store
A centralized repository for ML features that serves both training (batch) and inference (real-time).
Offline features: Historical data for model training
Online features: Low-latency access for real-time predictions
Tools: Feast, Tecton, SageMaker Feature Store, Databricks Feature Store
Why it matters: Prevents feature engineering duplication. Data scientists define features once, use them everywhere.
🧪 ML Models
Where do models live in your architecture?
Training pipelines: Scheduled jobs to retrain models
Model registry: Version control for models
Model serving: Batch predictions vs real-time API endpoints
Tools: MLflow, Kubeflow, SageMaker, Azure ML
🧠 GenAI Initiatives
This is hot right now. Show you’re aware of the trends:
Vector databases: Store embeddings for semantic search (Pinecone, Weaviate, Chroma)
RAG (Retrieval Augmented Generation): Combine LLMs with your data
LLM integration: How do your data pipelines feed GenAI apps?
Real-World Examples to Share
When you mention ML/AI, ground it in real experience:
✅ “In my last role, we built a feature store to support the fraud detection team. We reduced their feature engineering time from weeks to days.”
✅ “I worked with the ML team to create a data pipeline that refreshed model training data daily, which improved model performance by 15%.”
✅ “We implemented a RAG system that allowed our customer support team to query internal docs using natural language.”
✅ “I helped set up MLflow for model versioning and tracking, which gave us reproducibility and audit trails.”
How to Position This in the Interview
Don’t go deep unless the interviewer asks
Show collaborative mindset: “supporting the ML team,” “enabling data scientists”
Keep it high-level architecture, not deep ML theory
Focus on the data engineering challenges (freshness, quality, scale)
💡 Pro tip: If the job description mentions ML or AI, definitely bring this up. If not, mention it briefly to show breadth, then move on.
6️⃣ Tools Layer: The Professional Touch 🛠️
This is a complementary section where you show you’re not just an ETL developer—you’re a complete data engineer who thinks about the full lifecycle.
This layer is cross-cutting; it applies to all the other layers.
Infrastructure as Code (IaC)
Tools: Terraform, CloudFormation, ARM templates, Pulumi
Why mention this:
Shows you understand infrastructure should be version-controlled
Demonstrates reproducibility thinking
Critical for disaster recovery and multi-environment setup
What to say:
“I’d use Terraform to provision all infrastructure—databases, compute clusters, networking, storage. This gives us version control, automated deployments, and the ability to recreate environments on demand.”
What to provision with IaC:
Data warehouse / database instances
Storage accounts / buckets
Compute clusters (Spark, Kubernetes)
Networking (VPCs, subnets, firewalls)
IAM roles and permissions
Version Control
Tools: Git (GitHub, GitLab, Bitbucket)
Why mention this:
“All code—SQL, Python, infrastructure—goes into Git. We follow trunk-based development with feature branches and PR reviews.”
What goes in version control:
ETL/ELT code
dbt models
Infrastructure definitions
Documentation
Data quality tests
CI/CD Pipelines
Tools: GitHub Actions, GitLab CI, Jenkins, Azure DevOps
Why mention this:
Shows you think about automation and deployment safety.
What to include in CI/CD:
Automated testing (unit tests, integration tests, data quality tests)
Code linting and formatting
Deployment to dev → staging → production
Automated rollback on failure
Notifications to team on failures
What to say:
“Every PR triggers automated tests. Once merged, changes deploy to dev automatically, then staging with approval, then production. This ensures we catch issues early and deploy safely.”
Data Catalog
Tools: DataHub, Collibra, Alation, AWS Glue Catalog, Azure Purview
Why mention this:
Shows you care about discoverability and documentation.
Key features:
Metadata management: What data exists and where
Data lineage: How data flows through pipelines
Business glossary: What do the metrics mean?
Discovery: Help users find relevant datasets
Access control: Who can see what
What to say:
“We’d implement a data catalog so business users can discover datasets, understand lineage, and know who to contact with questions. This reduces tribal knowledge and accelerates analytics.”
Monitoring, Alerts & On-Call 🚨
Tools: Datadog, PagerDuty, Grafana, CloudWatch, Azure Monitor
Why mention this:
Shows you understand data engineering is an operational discipline, not just building pipelines.
What to monitor:
Data freshness: Is data arriving on schedule?
Data quality: Are validation checks passing?
Pipeline failures: Which jobs failed and why?
Resource utilization: Are we over/under-provisioned?
Cost: Are we staying within budget?
SLA compliance: Are we meeting our commitments?
What to say:
“I’d set up monitoring for data freshness, quality, and pipeline health. We’d have alerts that page on-call engineers for critical failures, but also slack notifications for warnings. The key is avoiding alert fatigue—only page for things that need immediate action.”
On-call practices:
Rotation schedule (don’t burn people out)
Runbooks for common issues
Post-mortems for major incidents
Continuous improvement of alert quality
Data Quality Framework
Tools: Great Expectations, dbt tests, Soda, custom validation
Pro tip: dbt can handle all these tests out of the box!
Why mention this:
Data quality is one of the biggest pain points in data engineering. Show you take it seriously.
Types of tests:
Schema tests: Expected columns present and correct type
Null checks: Required fields aren’t null
Uniqueness: Primary keys are actually unique
Referential integrity: Foreign keys are valid
Range checks: Values within expected bounds
Custom business logic: Revenue shouldn’t be negative, etc.
Where to test:
At ingestion (catch bad data early)
After transformation (validate business logic)
Before pushing to production (gate deployments)
What to say:
“I’d implement data quality checks at every stage using dbt tests and Great Expectations. Failed tests block deployment and trigger alerts. We’d track data quality metrics over time to identify degradation.”
FinOps (Cost Management) 💰
Why mention this:
Shows you understand data platforms can get expensive, and cost awareness is part of your job.
What to cover:
Cost monitoring: Track spending by project/team/environment
Resource tagging: Tag all resources for chargeback/showback
Query optimization: Tune expensive queries
Storage lifecycle policies: Move old data to cheaper tiers
Right-sizing: Don’t over-provision compute
Spot/preemptible instances: Use for non-critical workloads
What to say:
“I’d implement tagging for all resources so we can track costs by team. We’d set up alerts for unexpected spend spikes, and regularly review expensive queries and storage to optimize costs.”
Common cost optimizations:
Partition tables by date (scan less data)
Cluster tables by commonly filtered columns
Use materialized views for expensive aggregations
Compress data (Parquet, ORC, Delta)
Auto-pause warehouses when not in use
Use storage tiers (hot, cool, archive)
🎓 Interview Strategy: How to Actually Use This Guide
Before You Start Drawing
1. Clarify Requirements (5 minutes)
Don’t jump straight into architecture. Ask questions first:
What’s the core business use case?
What’s the data volume?
What are the latency requirements?
What’s the budget? (Build vs buy)
What cloud platform?
What’s already in place?
Who are the end users?
2. State Your Assumptions
“Based on what you’ve told me, I’m assuming...”
Daily batch processing will meet requirements
We’re starting from scratch (no legacy systems)
We have a team of 5 data engineers
Budget is moderate (not unlimited, not shoestring)
This shows structured thinking and gives the interviewer a chance to correct you.
While You’re Designing
1. Go Breadth-First, Then Depth
Cover all six layers at a high level first (10-15 minutes). Then ask: “Where would you like me to go deeper?”
This shows you can see the whole system while also knowing when to dive into details.
2. Think Out Loud
“I’m considering two approaches here... Option A would be simpler but less scalable. Option B would handle growth better but adds complexity. Given the requirements, I’d lean toward Option A because...”
This is exactly what they want to hear. There are rarely “right” answers—only trade-offs.
3. Draw as You Talk
Your diagram should evolve as you narrate. Don’t draw everything silently then explain.
“So first, we have these source systems... they feed into... which lands data here... then we transform using...”
Questions to Expect (Be Ready)
Scalability:
“What if data volume increases 10x?”
“How does this handle peak load?”
Failure Scenarios:
“What happens if the source API goes down?”
“How do you recover from a failed pipeline?”
Security:
“How do you handle PII/sensitive data?”
“What about access control?”
Operations:
“How do you deploy changes?”
“How do you monitor this?”
“Who’s on-call when it breaks?”
Trade-offs:
“Why did you choose X over Y?”
“What are the downsides of your approach?”
Do’s ✅
Ask clarifying questions before diving in
Explain your reasoning for every choice
Acknowledge trade-offs (nothing is perfect)
Mention multiple options even if you recommend one
Show production thinking (monitoring, costs, operations)
Adapt based on feedback (don’t be rigid)
Use real examples from your experience
Keep track of time (breadth first, then depth)
Don’ts ❌
Don’t assume requirements - ask!
Don’t jump to a specific tool without justifying
Don’t over-engineer - start simple, add complexity only when needed
Don’t ignore operational concerns - it’s not done when the code works
Don’t claim there’s one right answer - it’s all trade-offs
Don’t be silent - think out loud
Don’t go too deep too early - cover breadth first
🚀 Your Action Plan
Now that you have the framework, here’s how to prepare:
📝 Week 1: Internalize the Framework
Review the six layers until you can draw them from memory
Practice explaining each layer in 2-3 sentences
Write down your own experiences for each layer
🎨 Week 2: Practice Drawing
Pick 3-5 different scenarios (e-commerce, fintech, e-commerce, etc.)
Draw the architecture for each from scratch
Time yourself (aim for 30 minutes for a full design)
🗣️ Week 3: Mock Interviews
Find a peer or mentor to practice with
Record yourself and watch it back
Get feedback on communication, not just technical accuracy
📊 Week 4: Deep Dive Your Weak Areas
Streaming? Read up on Kafka and Spark Streaming
Data modeling? Study dimensional modeling and normalization
ML systems? Learn about feature stores and MLOps
🔄 Continuous Improvement
After every real interview, write down what you struggled with
Update your own mental model
Keep learning from real systems you build
🎁 Bonus: Common Scenarios to Practice
Want to test your skills? Try designing these systems:
📱 Scenario 1: E-commerce Analytics
Requirements: Track user clickstream, orders, inventory. BI team needs daily dashboards. Marketing wants near-real-time campaign performance.
💳 Scenario 2: Fraud Detection
Requirements: Credit card transactions, need to flag suspicious activity within seconds. Also need historical analysis for model training.
🏥 Scenario 3: Healthcare Data Platform
Requirements: Patient records from multiple hospitals, strict compliance (HIPAA), clinical researchers need de-identified data.
🎮 Scenario 4: Gaming Analytics
Requirements: Player events, millions of users, need to detect cheating in real-time, also power personalized recommendations.
🚗 Scenario 5: IoT Fleet Management
Requirements: GPS and telemetry from 10,000 vehicles, predict maintenance needs, optimize routes, provide real-time dashboard for dispatchers.
For each scenario:
Draw the architecture
Justify your choices
Identify the biggest technical challenges
Estimate rough costs
Plan for failure scenarios
📚 Additional Resources
Books:
Designing Data-Intensive Applications by Martin Kleppmann
Fundamentals of Data Engineering by Joe Reis and Matt Housley
The Data Warehouse Toolkit by Ralph Kimball
Helpful articles:


covers it all!! great. Looking for more posts like these.